
Figure 4. PILRα-Ig positive clones show increased cytotoxicity and degranulation upon interaction with PILRα expressing target cells.
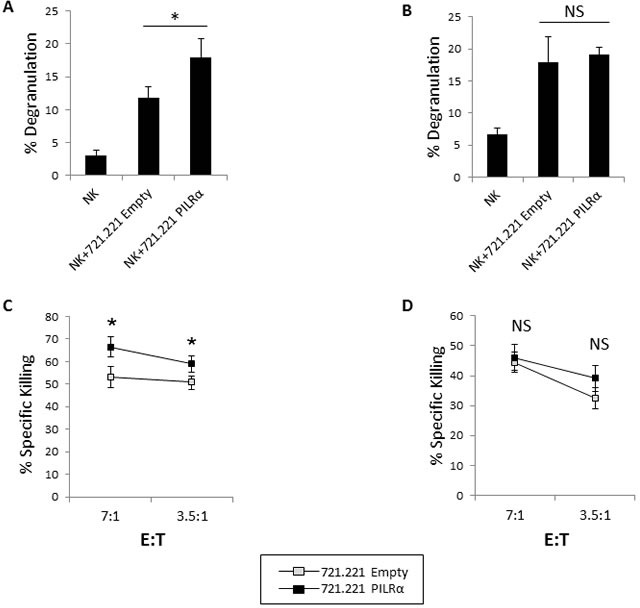
A., B. Percent of NK cell degranulation by PILRα-Ig positive NK clones (A) and by PILRα-Ig negative NK clones (B) following incubation with 721.221 cells transfected either with an empty vector as control, or with PILRα. Degranulation percentage was determined by CD107A FACS staining, *p < 0.05. C., D. Percent of specific NK cell killing by PILRα-Ig positive NK clones (C) and by PILRα-Ig negative NK clones (D) following incubation with 721.221 cells transfected either with an empty vector as control, or with PILRα. Figure show one representative experiment out of at least 3 performed. *p < 0.05, NS-not significant. Statistics was performed using student T-test.