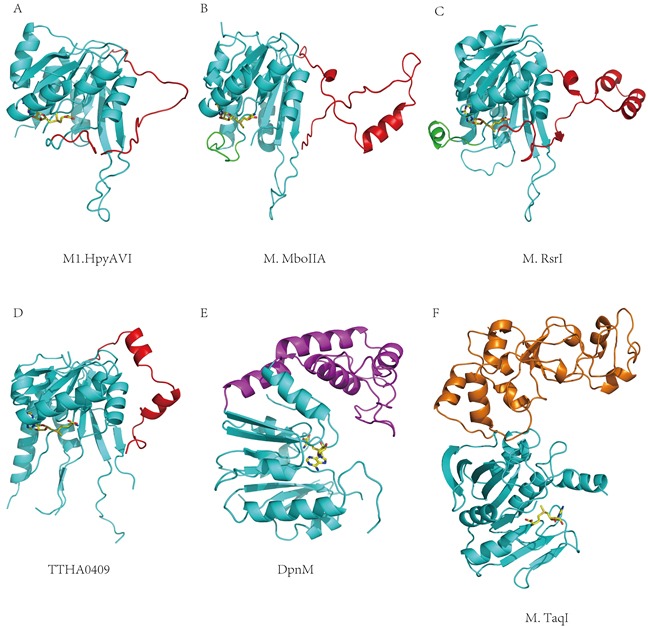
Figure 3. Structural comparisons between M1.HpyAVI and other DNA MTases.

A. M1.HpyAVI; B. M.MboIIA; C. M.RsrI; D. TTHA0409; E. DpnM; F. M.TaqI. M1.HpyAVI possesses only a long disorder TRD region, compared with the structure-rich TRD of M.MboIIA, M.RsrI and TTHA0409, or the extra DNA-binding domain of DpnM and M.TaqI. The core structure is in cyan; TRD of M1.HpyAVI, M.MboIIA, M.RsrI and TTHA0409 is in red; The region between β4 and αD of M.MboIIA and M.RsrI is in green; DNA-binding domain of DpnM is in magenta; The C-terminal domain of M.TaqI is in orange.
