
Figure 4. Structural and biochemical analyses define two conserved residues D29 and E216 to be the key sites for AdoMet binding.
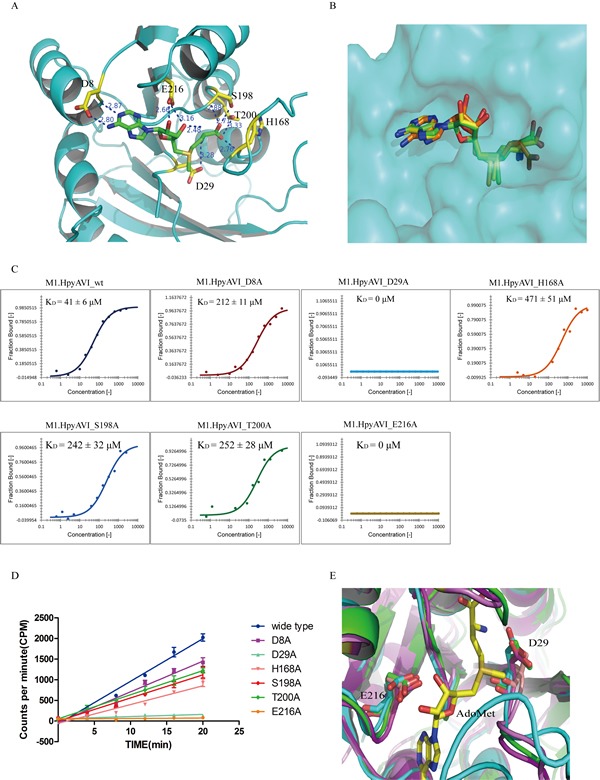
A. The cofactor-binding cavity of M1.HpyAVI. Residues (yellow) that form direct hydrogen bonds with AdoMet (green) are indicated, distance of the hydrogen bond is marked. B. Superposition of AdoMet in the structures of M1.HpyAVI (green), DpnM (yellow) and M.TaqI (orange). The AdoMet terminal carboxyl of M.TaqI reveals different orientations. C. Cofactor binding affinity of wt-/mutants M1.HpyAVI proteins analyzed by microscale thermophoresis (MST). The binding affinity was determined between fluorescently labelled M1.HpyAVI protein and unlabeled AdoMet. The bound fraction is shown on the y-axis against the protein concentration. AdoMet (15 nM to 1 mM) was titrated into a fixed concentration of M1.HpyAVI wt/mutant proteins (800 nM). The dissociation constant (KD) is yielded according to the law of mass action from the isotherm derived of the raw data: M1.HpyAVI-wt: 41 ± 6 μM; M1.HpyAVI-D8A :212 ± 11 μM; M1.HpyAVI-D29A : 0 μM; M1.HpyAVI-H168A : 471 ± 51 μM; M1.HpyAVI-S198A : 242 ± 32 μM; M1.HpyAVI-T200A : 252 ± 28 μM; M1.HpyAVI-E216A : 0 μM. Standard for three replicates is indicated. Measurements were made with 40% LED and 40% laser power at 25°C. D. DNA methyltransferase activity of wide type protein and the mutants is quantified using radioactive assay. [3H]-methyl transferred to duplex DNA containing 5′-GAGG-3′ was quantified by Beckman LS6500 for 10 min, experiments were repeated for three times and data were corrected by subtraction of the background. E. Superposition of M1.HpyAVI (green) with M.MboIIA (cyan) and M.RsrI (magenta). Residues D29 and E216 are conserved through all the DNA MTases mentioned in Figure 3 (not shown in Figure 4).