
Figure 2. Dia induced dendritic cells (DCs) maturation.
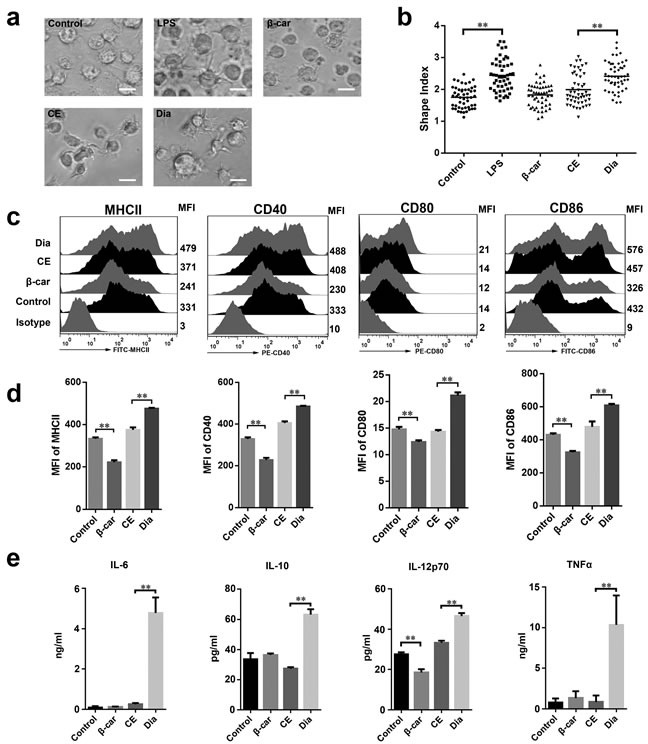
a. DCs were treated with DMSO (equal volume to Dia, as control), LPS (10 ng/ml), β-carotene (β-car) (1 μM), CE (equal volume to Dia) or Dia (1 μM) respectively for 24 hours and morphology of DCs dendrites were observed by microscopy. Scale bar = 30 μm. b. The statistical result of the cellular shape index. Horizontal lines across the scatter diagram represent mean values. n = 50 (50 dendritic cells randomly selected from 3 separate experiments). c. DCs with different treatments were stained for the indicated surface molecules and analyzed by FACS. d. The mean fluorescence intensity (MFI) values of indicated surface molecules are shown as the mean ± SD. e. Supernatants of DCs culture were collected and tested for IL-6, IL-10, IL-12p70, and TNFα by ELISA. Data are represented as mean ± S.D. One representative of three similar independent experiments is shown.