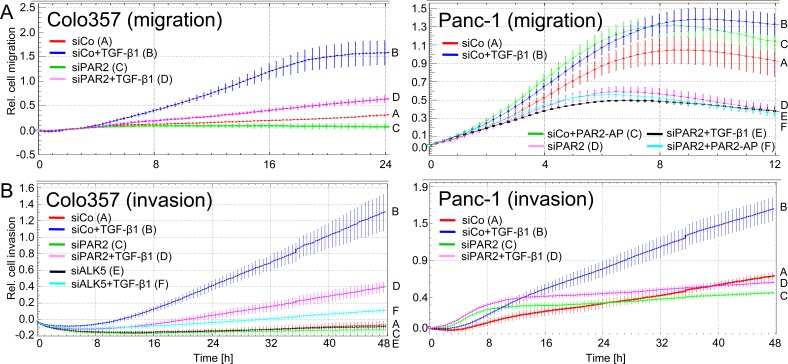
Figure 1. RNA interference mediated cellular depletion of PAR2 suppresses TGF-β1-induced cell motility.
The coloured curves indicate the real-time cell migration data of the various cell populations with the slope of the curve being proportional to the migration velocity of cells. A. Cell migration in Colo357 and Panc-1 cells transiently transfected with scrambled control siRNA (siCo) or PAR2 siRNA (siPAR2) and treated or not with TGF-β1 during the entire assay. For Colo357 cells, differences between siCo + TGF-β1 (left-hand graph, blue curve/B) and siPAR2 + TGF-β1 (left-hand graph, magenta curve/D) are significant at the 8 h and all later time points. For Panc-1 cells, data for siCo + TGF-β1 (left-hand graph, blue curve/B) and siPAR2 + TGF-β1 (right-hand graph, black curve/E), and between siCo + PAR2-AP (right-hand graph, green curve/C) and siPAR2 + PAR2-AP (right-hand graph, cyan curve/F) are significantly different at the 8 h and all later time points. B. The same as in A except that the assay was run in an invasion setup with Matrigel as barrier. In addition, ALK5 siRNA was used as a control for blocking the pro-invasive TGF- effect (for validation of this siRNA in Colo357 cells see Figure 5B). Data for siCo + TGF-β1 (blue curve/B) and siPAR2 + TGF-β1 (magenta curve/D) from both cell lines are significantly different (p < 0.05) at the 16 h and all later time points. Data in A and B were derived from three parallel wells, represent the mean ± SD and are representative of three assays. Letters on each graph's right-hand side allow for colour independent identification of the curves.

