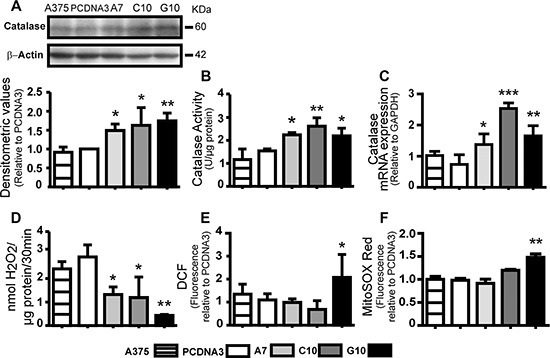
Figure 1. Catalase-transfected A375 cells (A7, C10 and G10) decreased H2O2 levels but differentially induced ROS levels.

Control: A375 cells transfected with empty vector (PCDNA3) and not transfected (A375). (A) Representative immunoblot images of catalase and β-actin with its densitometric analysis. Actin values were used to normalize samples. Full length blots are included as Supplementary Figure S4. (B) Determination of catalase activity by spectrophotometric method. (C) Catalase mRNA expression by qPCR (D) Quantification of H2O2 production by Amplex® Red kit. (E–F) Intracellular ROS levels by quantification of DCF and MitoSOX Red mean fluorescence. Data are expressed as mean ± SD. *p < 0.05; **p < 0.01; ***p < 0.001 vs control (PCDNA3).
