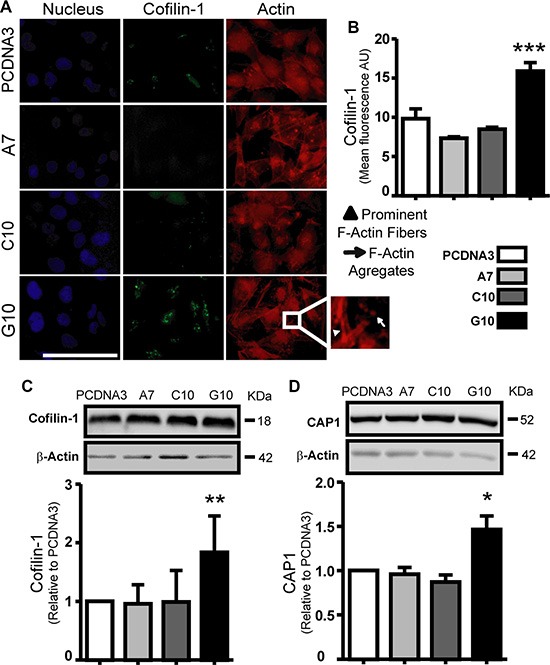
Figure 5. Catalase overexpression induced cofilin-1 and CAP1 expression.

A375 cells transfected with catalase (A7, C10 and G10) relative to control, A375 cells transfected with empty vector (PCDNA3). (A) Representative immunocytofluorescence images of cofilin-1 with their corresponding actin and nuclear staining using rhodamine phalloidin and DAPI respectively. Bar represents 100 μm. Inset image of G10 exhibits its prominent F-actin and F-actin aggregates. (B) Quantification of cofilin-1 expression as the mean cell fluorescence arbitrary units (AU). (C–D) Representative immunoblot images of cofilin-1 and CAP1 protein expression with their respective densitometric analysis. Actin values were used to normalize samples. Full length blots are included as Supplementary Figure S5. Data are expressed as mean ± SD. *p < 0.05; **p < 0.01; ***p < 0.001 vs control.
