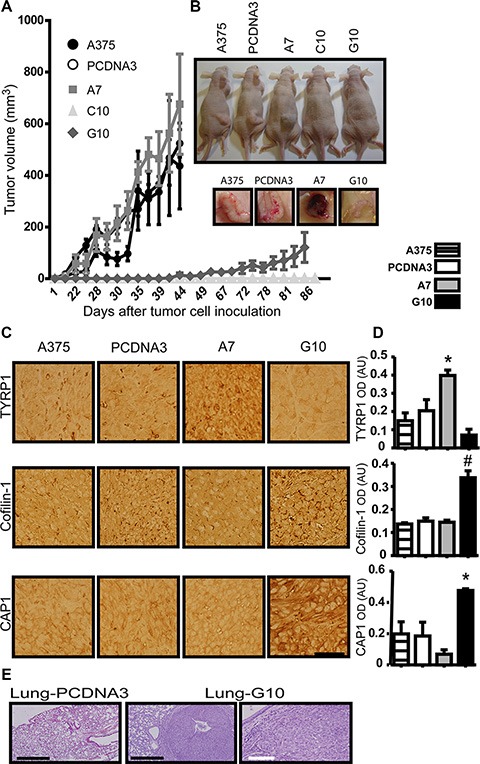
Figure 6. In vivo validation of in vitro results in tumors induced by melanoma cells overexpressing catalase.

Nude mice inoculated with A375 cells transfected with catalase (A7, C10 and G10), with empty vector (PCDNA3) or not transfected (A375). (A) Tumor growth curves over time post-inoculation by monitoring tumor volume throughout time. (B) Representative images of mice inoculated with each cell type and the respective tumors of the tumorigenic ones: A375, PCDNA3, A7 and G10. (C) Representative images of TYRP1, cofilin-1 and CAP1 IHC detection in tissue sections of tumors induced by A375, PCDNA3, A7 and G10 cells. Bar represents 50 μm. (D) Quantification of IHC by optic densitometric (OD) analysis of images. Data are expressed as mean ± SD. *p < 0.05; #p < 0.001 vs control (PCDNA3). (E) Lung tissue sections stained with H&E. Representative images of G10 lung nodules indicate its metastatic ability. Control lung tissue section is also shown. Black bars represent 500 μm and white bar 100 μm.
