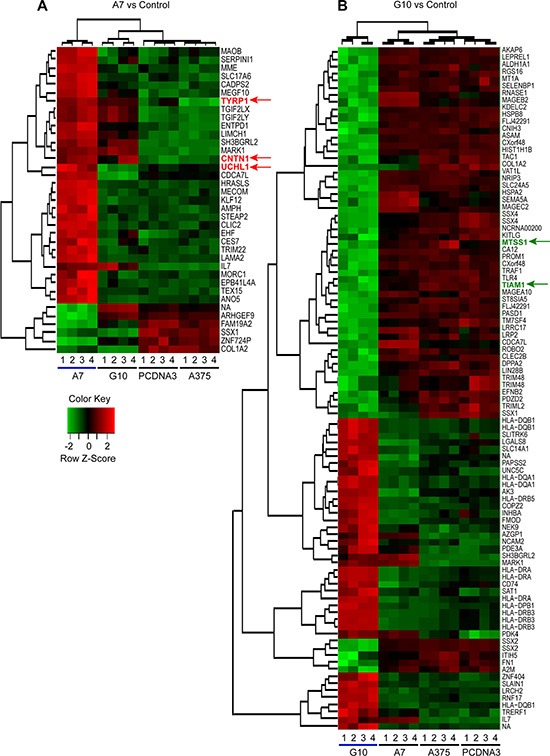
Figure 1. Differential gene expression and clustering analysis of upregulated and downregulated genes in A7 (A) and G10 (B) cells.

Average result from A375 and PCDNA3 cells were used as control. Genes selected for qPCR analysis are indicated with colored arrows (red for upregulated in A7 vs controls and green for downregulated in G10 vs controls). Analysis was conducted with lfc = 2 and p ≤ 0.0001. Key color: red for upregulated and green for downregulated genes.
