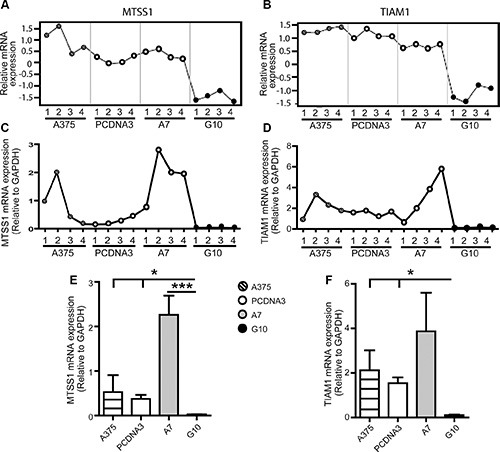
Figure 3. Validation of microarray data by qPCR analysis of selected G10 downregulated genes: MTSS1 and TIAM1.

A375 and PCDNA3 cells were used as control cells. Four RNA samples (1–4) were evaluated per condition. The same RNA samples were used for both assays for comparison purposes. (A–B) Microarray gene expression profiles of MTSS1 and TIAM1. (C–D) mRNA expression profiles of selected genes determined by real time PCR relative to GAPDH. (E–F) Results of mean ± SD of qPCR analysis vs controls or A7, *p < 0.05, ***p < 0.001.
