
Figure 4. Melanoma prognostic signatures.
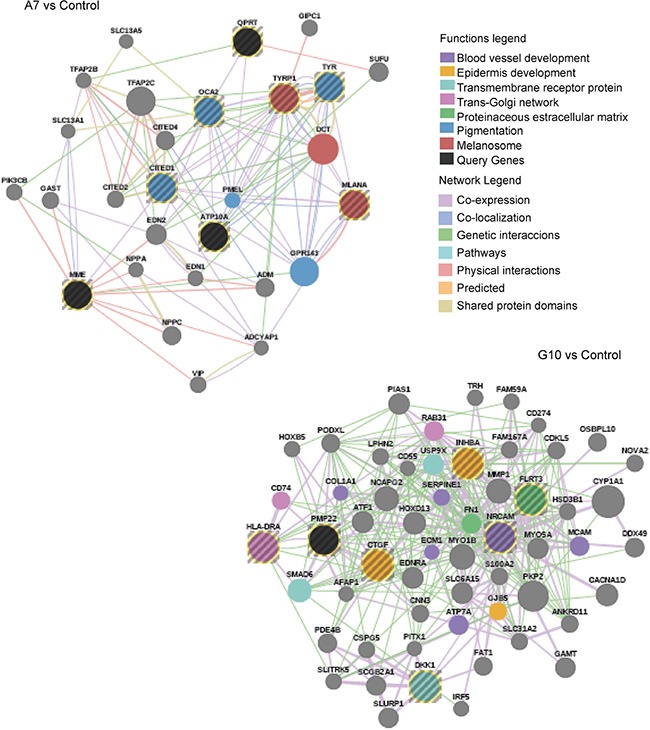
Co-overexpressed clustered genes defined a priori from bibliographic prognostic signatures by GSEA in A7 and G10 vs control (average result of A375 and PCDNA3). Query genes are represented by circles with gray stripes. Besides, connections among query genes linked to each other and to neighboring genes (smooth circles) are represented in the figure with different color lines according to their type of interaction. Gene colors represent the functions to which they are associated. Networks are visualized by GeneMania.