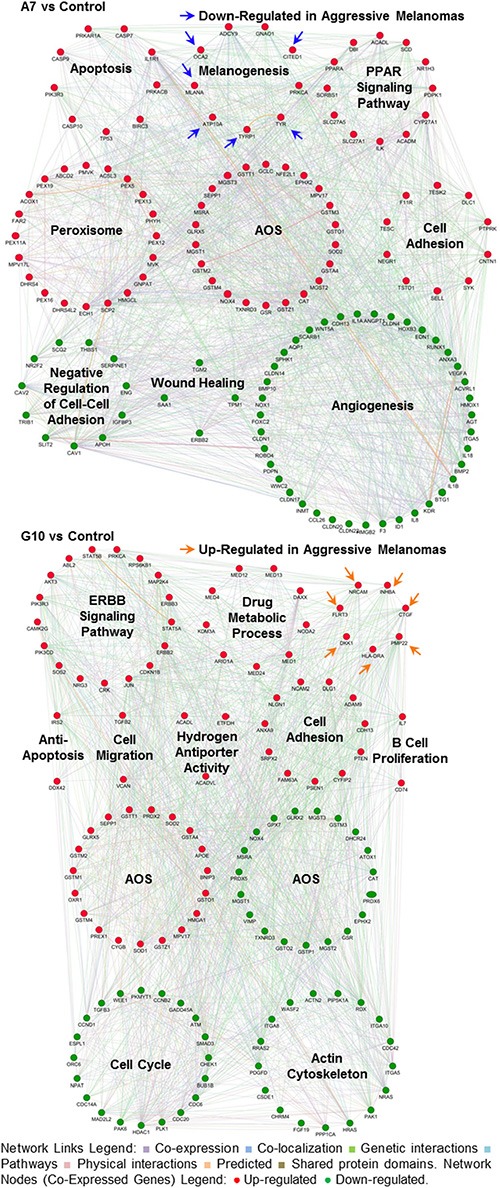
Figure 7. Gene networks associated with signaling pathways and prognostic signatures after reprogramming the AOS network in A7 and G10.

Coexpression of genes supports the different phenotypes of A7 and G10 vs control (average result of A375 and PCDNA3). Up or downregulated genes are represented by red or green circles, respectively (Network Nodes). Connections among genes linked to each other are represented in the figure with different color lines according to their type of interaction (Network Links Legend). Arrows show genes from prognostic signatures associated with aggressive melanomas. The upregulation of these genes in A7 supports its less aggressive phenotype while in G10, its more aggressive one. Networks are visualized by GeneMania.
