
Figure 2. Depletion of snail inhibits melanoma invasion in vitro and in vivo.
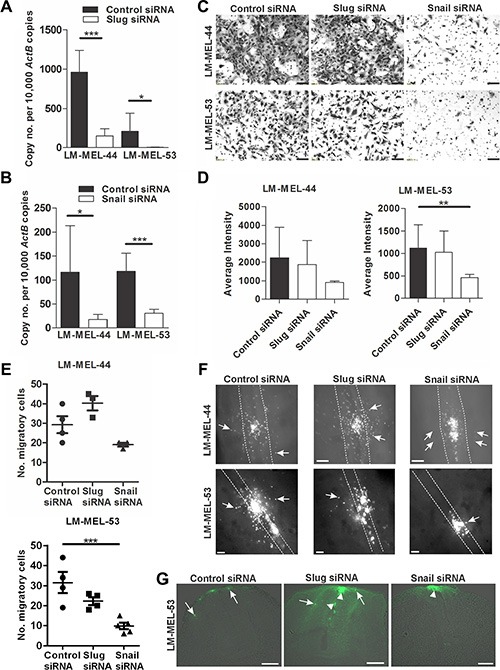
Melanoma cells were plated out and transfected with either 10 nM control siRNA, Snail or Slug specific siRNA. After 72 h RNA was extracted and Slug (A) and Snail (B) qRT-PCR was performed on melanoma lines LM-MEL-44 and LM-MEL-53. Difference in gene expression was analysed using Student's t-test (*p < .05, ***p < .0005). Error bars indicate SEM of three experiments in triplicate. (C) Melanoma cells from LM-MEL-44 and -53 were transfected as described and seeded in a Matrigel coated transwell for 24 h. Cells that invaded the transwell membrane were stained with 1% crystal violet and representative images of the membrane were captured (scale bar = 100 μm). (D) Quantitative analysis of the number of invasive cells on the transwell membrane was determined by measuring the average intensities of invasive cells calculated in K counts mm2 using Odyssey Software. Error bars indicate SEM of three independent experiments in triplicate. Data was analysed using ANOVA with post-hoc Tukey test (**p < .005). (E–G) Melanoma cells were labelled with CM-DiO, transfected with the indicated siRNAs, cultured as hanging drops and introduced into the trunk neural tube of chicken embryos. After 2 days embryos were harvested and fluorescence pictures taken from whole-mounts. (E) The number of cells that migrated out of the neural tube was counted. Bars indicate mean +/− SEM. This data was combined with data using the same cell lines from Figure 7 and analysed using ANOVA with post-hoc Tukey test. Significantly fewer Snail siRNA treated cells migrated from the neural tube compared to control siRNA treated cells using LM-MEL-53 (*p < .05). (F) Whole-mount dorsal images of representative embryos (scale bar = 100 μm). White dotted lines show the outline of the neural tube and the white arrows indicate fluorescent melanoma cells that migrated out of the neural tube and into the surrounding tissue. (G) Images from cross-section of embryos show motility of melanoma cells. Arrows indicate the motile melanoma cells, arrowheads point to melanoma cells that remain inside the neural tube (scale bar = 100 μm).