
Figure 4. Targeting NTN4 results in loss of invasive potential of melanoma cells in vitro.
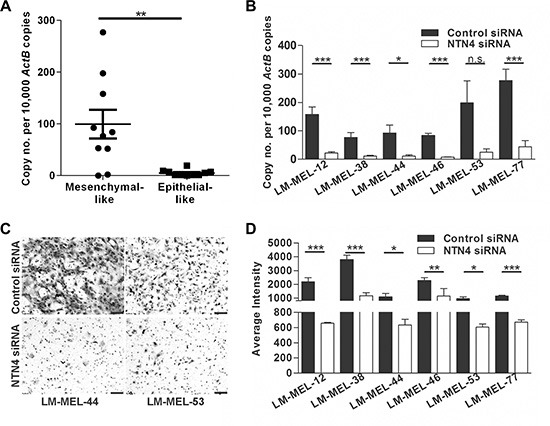
(A) NTN4 expression in ten mesenchymal- and epithelial-like melanoma cell lines was tested by qRT-PCR. Bars indicate mean +/− SEM (t-test, **p < .005). (B) Melanoma cell lines were transfected with either 10 nM control siRNA or NTN4 specific siRNA and NTN4 qRT-PCR was performed after 72 h (t-test, *p < .05, ***p < .0005, n.s = not significant). (C–D) The in vitro invasive ability of these cells lines was tested using a Matrigel assay. (C) Representative images of invasive cells were taken (scale bar = 100 μm) and (D) average intensities of invasive cells calculated in K counts mm2 using Odyssey Software. Bars indicate mean +/− SEM of three independent experiments in triplicate. Data was combined with data from same cell lines in Figure 3 and Figure 5 and analysed using ANOVA, with post-hoc Tukey test to identify treatments significantly different from control (*p < .05, **p < .005, ***p < .0005).