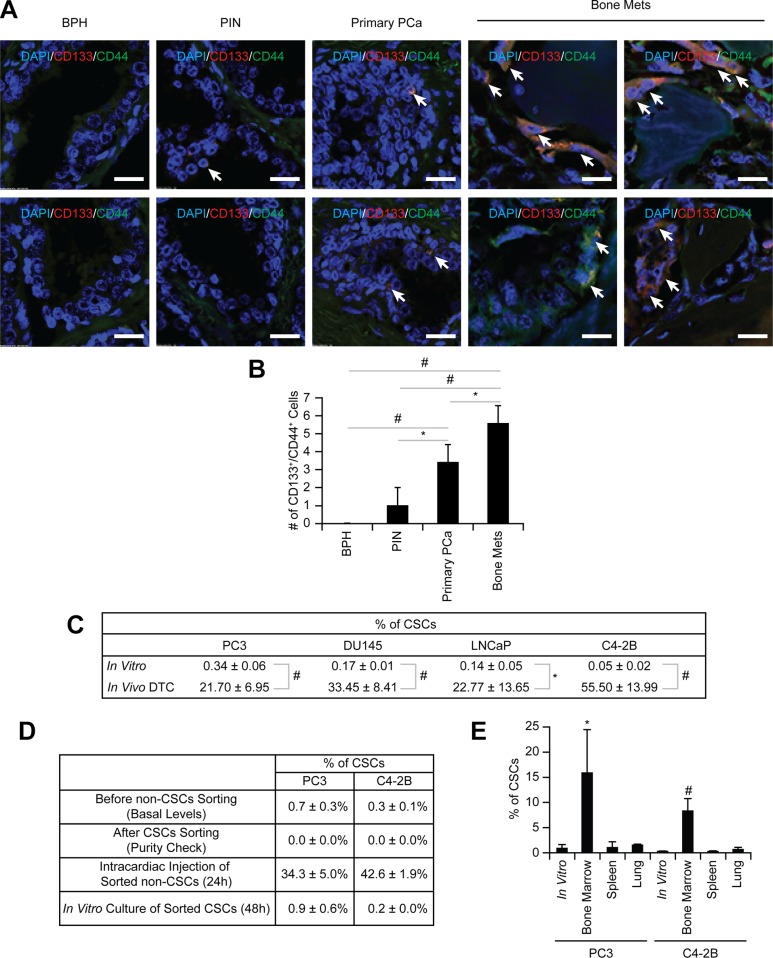
Figure 1. Enrichment of CSCs in disseminated prostate cancer.
(A) Representative elements of a prostate cancer tissue microarray co-stained with anti-CD133 and anti-CD44 antibodies. Nuclei were identified by DAPI. (60× Zoom2, Bar = 20 μm). (B) Quantitative analysis of CSC staining in Figure 1A. *p < 0.05 and #p < 0.01 (Student's t-test). BPH: benign prostatic hyperplasia; PIN: prostatic intraepithelial neoplasia; Primary prostate cancer: primary prostate cancer; and Bone mets: bone metastatic prostate cancer. (C) The % of CSC population in in vitro cultured prostate cancer and in vivo DTCs by flow cytometry. Significance vs. in vitro cultured prostate cancer (Student's t test). (D) Non-CSC prostate cancer cells were sorted and subsequent flow cytometry analyses confirmed no residual contamination of CSC cells. Pure non-CSCs were either inoculated into SCID mice through intracardiac injection (n = 5) or cultured in vitro, and the CSC population was analyzed. (E) CSC expression in prostate cancer recovered from the lung, spleen, or bone marrow following intracardiac injection (n = 5). *p < 0.05 and #p < 0.01 vs. in vitro cultured prostate cancer (Student's t test).

