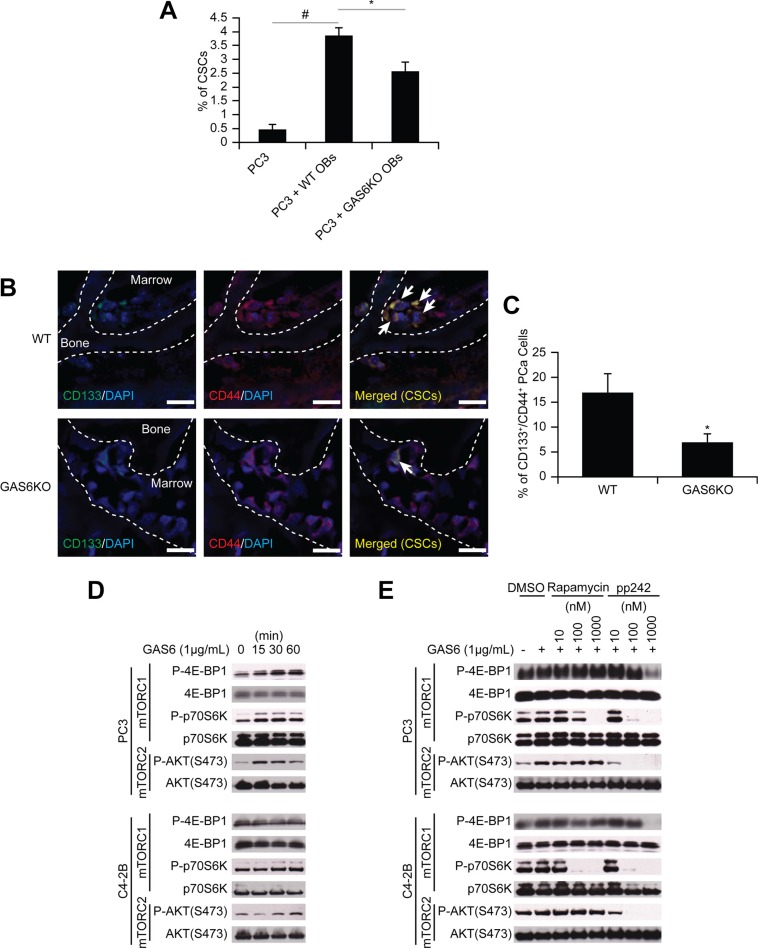
Figure 4. GAS6 expressed by the osteoblastic niche controls the conversion of DTCs to CSCs through mTOR signaling.
(A) The % of CSCs by flow cytometry in PC3 cells co-cultured with osteoblasts from GAS6+/+ (WT) and GAS6−/− (GAS6KO) mice (Student's t-test). (B) PC3 cells (1 × 10⁴ cells per 10 μL) were placed directly into vertebral bodies (vossicles) derived from WT and GAS6KO mice and transplanted into immunodeficient mice (n = 6). At 1 month, the vossicles were dissected, and the expression of CSCs by prostate cancer was evaluated by immunohistochemistry. (60× Zoom 2.5, Bar = 20 μm). Arrows denote CSCs. (C) Quantitative analysis of CSC staining in Figure 4B. The CD133+CD44+ cells within six randomly selected representative images per group were counted, and then normalized with total numbers of cells. *p < 0.05 vs. CSCs in WT vossicle (Student's t-test). (D) Activation of mTOR signaling with GAS6 treatment in prostate cancer. (E) Activation of mTOR signaling with GAS6 treatment in prostate cancer in the presence/absence of mTOR inhibitors (Rapamycin, 13346, Cayman Chemical; and pp242, 13643, Cayman Chemical).

