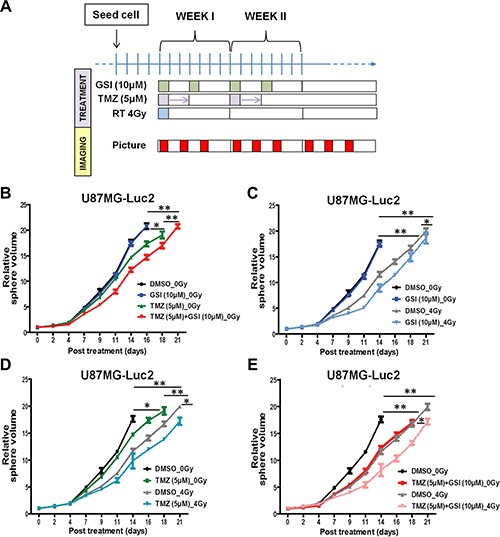
Figure 3. Effect of NOTCH inhibition combined with TMZ and RT on 3D spheroid growth in vitro.

(A) Schematic of the 3D spheroid assay treatment schedules. (B–E) Individual spheroid growth in U87 cells was imaged 3 ×/week and the volume was calculated after indicated treatments till time to reach 20× starting volume. Spheroid growth demonstrates delays upon different treatment combinations compared with DMSO as vehicle control. Error bars indicates SEM. Asterisk indicates significance (*p < 0.05, **p < 0.01 and ***p < 0.001, ns: not significant).
