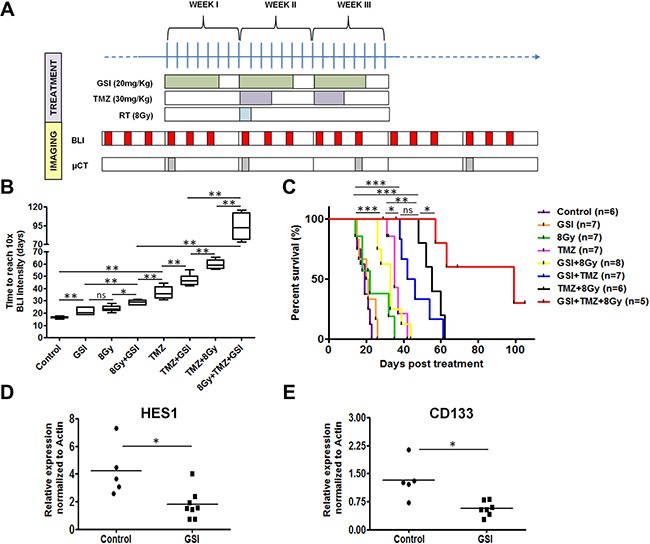
Figure 5. Effect of NOTCH inhibition combined with TMZ and RT in orthotopic U87MG-Luc2 glioblastoma in vivo.

(A) Schematic of the treatment schedules in vivo. (B) Tumor growth delay upon indicated treatments measured by BLI signal intensity for mice in each treatment group and the end point was when the BLI signal intensity reached to 10× intensity of the starting treatment day. (C) Kaplan-meier survival curve indicates number of days mice survived post-treatment. End-point was assessed based on the neurological sign and weight loss. (D–E) mRNA expression of the HES1 and CD133 in tumor samples treated with GSI vs. control was determined by qRT-PCR. Values were normalized to Actin. Error bars indicates SEM. Asterisk indicates significance (*p < 0.05, **p < 0.01 and ***p < 0.001, ns: not significant).
