
Figure 1. ROCK activity regulated chemoresistance in HCC cells.
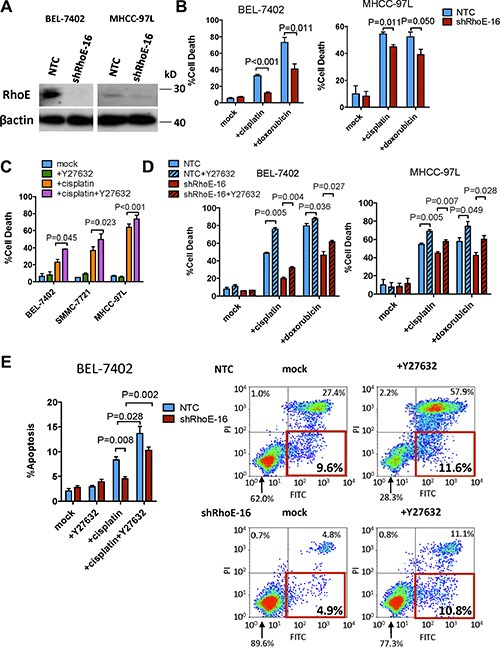
(A) Western blot showing RhoE protein levels in both non-target control and shRhoE-16 infected HCC cells. (B, C and D) Quantification of percentage of cell death induced by (B) 48-hour treatment of cisplatin and doxorubicin in non-target control (NTC) and RhoE knockdown cells, (C) 48-hour treatment of i) mock, ii) cisplatin, iii) Y27632, and iv) cisplatin and Y27632. (D) 48-hour treatment of cisplatin and doxorubicin with or without Y27632 in NTC and RhoE knockdown cells. (E) Annexin V flow cytometry assessment of the apoptotic cell population after 24 hours of cisplatin treatment with or without Y27632. Cells undergoing apoptosis are represented by the Annexin V+ve/PI−ve populations (red rectangles). In all panels, 3 experiments are represented. P-value was calculated using Student's t test. 20 ug/ml cisplatin and 10 μM Y27632 were used.