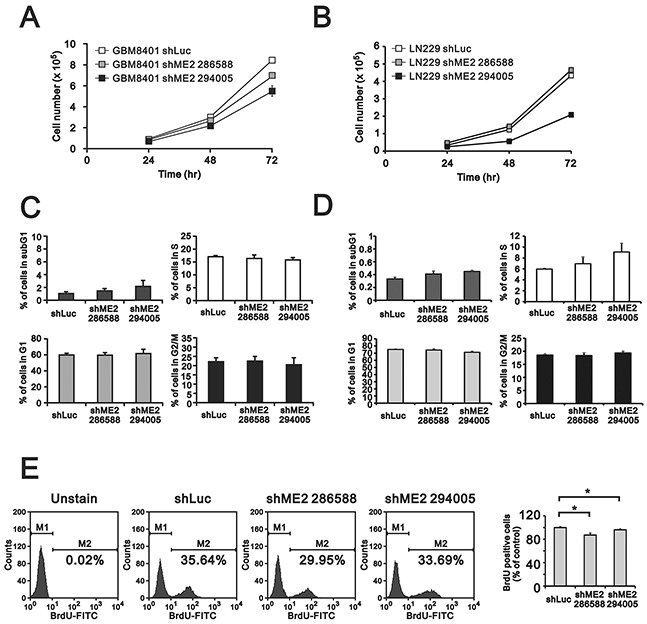
Figure 3. The effects of ME2 on cell proliferation and cell cycle profile in human glioma cell lines.

GBM8401 and LN229 shME2 cells were seeded (5×10⁴) in 12-well plates, and A. cell number were measured at the indicated time points; B. cell cycle analysis of GBM8401 and LN229 shME2 cells was determined by flow cytometry and C. BrdU incorporation by cells was performed using FITC BrdU Flow Kit. M1, BrdU-negative cells; M2, BrdU-positive cells. Cells untreated with BrdU was used as blank. The results of the statistical analysis are shown. Results are presented as the mean ± SD of triplicate samples from representative data of three independent experiments. (# p>0.05).
