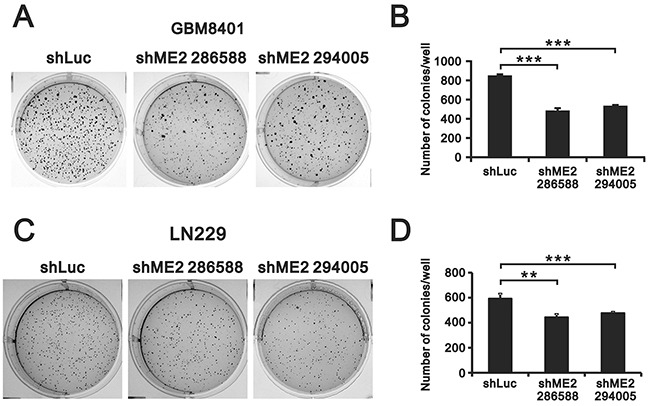
Figure 4. The effects of ME2 on soft-agar colony formation in human glioma cell lines.

Soft agar assays of GBM8401 and LN229 shME2 (286588 and 294005) and shLuc control cells are shown in A. and the statistical analysis is shown in B. Colonies > 0.5 mm were counted using ImageJ software. Results were presented as the mean ± SD of triplicate samples from representative data of three independent experiments. (*** P < 0.001).
