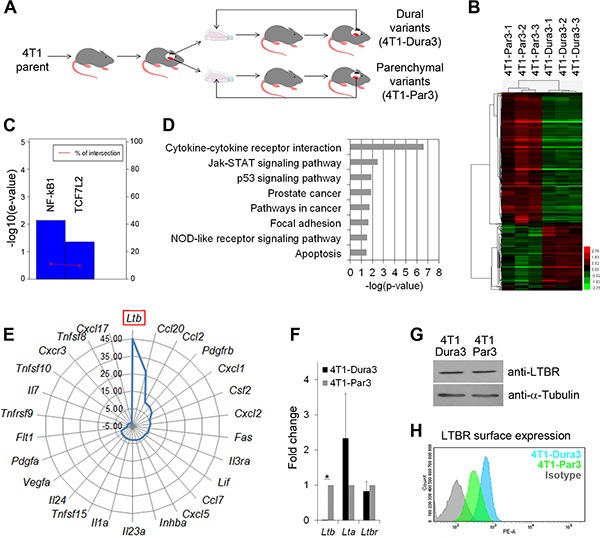
Figure 3. 4T1 cancer cells evolve distinct molecular profiles after they have metastasized to the dura versus brain parenchyma.

(A) Experimental outline for the in vivo selection of 4T1 cancer cell variants with site-specific characteristics. Dural cancer lesions are illustrated in black and parenchymal lesions in red. (B) Heat map and hierarchical clustering of genes differentially expressed between the 4T1-Par3 and 4T1-Dura 3 cancer cell variants. (C) Upregulation of the NF-kB1 and TCF7L2 (TCF4) transcription factor activity in parenchymal versus dural 4T1 cell variants. E-value scores and intersection percentage for significantly inhibited transcription factors (e-value < = 0.05) in dural versus parenchymal cell variants were determined using TFactS software. (D) Summary of the signaling pathways that were differentially regulated between the 4T1-Par3 and 4T1-Dura 3 cancer cell variants. (E) Graphic summary of the cytokines that were significantly upregulated in parenchymal versus dural 4T1 cancer cell variants. (F) Quantification of Ltβ, Ltα, and Ltβr mRNA by qRT-PCR. Statistical significance was determined using two-tailed Student's T-test with unequal variance (p ≤ 0.05). Error bars represent SD. (G) Analysis of total LTβR protein expression in whole cell lysates by Western blot. One out of three independent experiments is shown. (H) LTβR surface expression (MFI) is reduced in 4T1-Par3 versus 4T1-Dura3 cell lines as quantified by flow cytometry.
