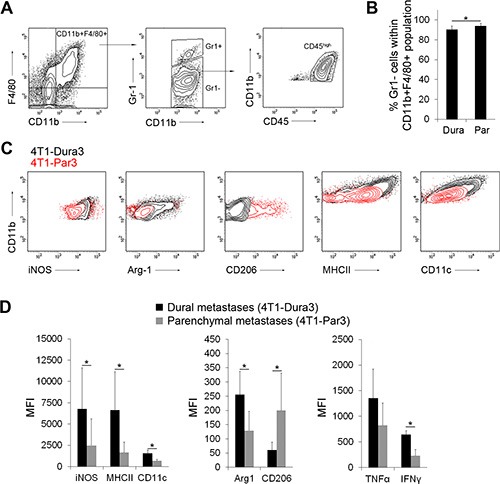
Figure 4. Distinct polarization state of dural and parenchymal MAMs.

(A) Gating strategy for CD11b+F4/80+Gr1−CD45high macrophages. An example of dural lesions is shown. (B) Quantification of CD11b+F4/80+Gr1−CD45high MAMs within dural 4T1-Dura3 and parenchymal 4T1-Par3 cancer lesions. (C) Representative histograms showing MFI for the expression of M1 (iNOS, MHCII) and M2 (Arginase-1 (Arg-1), CD206) macrophage markers in dural 4T1-Dura3 (black) and parenchymal 4T1-Par3 lesions (red) in intracarotid artery model. (D) Quantification of MFI for iNOS, MHCII, CD11c, Arg-1, CD206, TNFα and IFNγ; n = 9/11 for dural/parenchymal lesions, respectively. Statistical significance in B and D was determined using one-tailed Student's T-test with unequal variance (p ≤ 0.05). Error bars represent SD.
