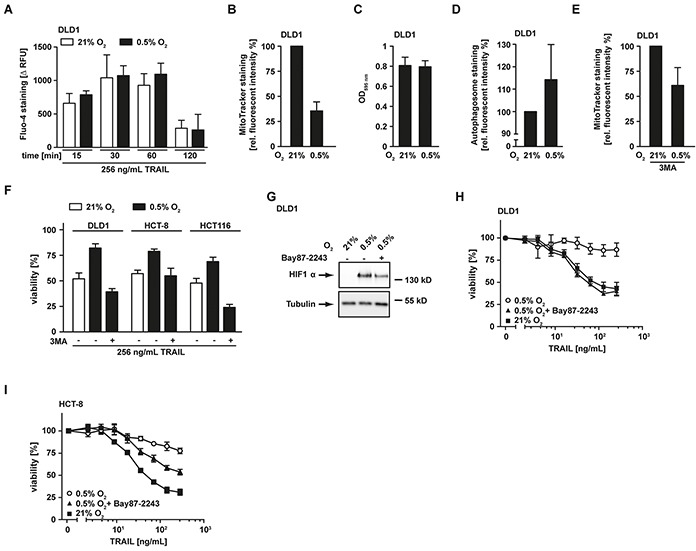
Figure 3. Hypoxia-induced mitochondrial autophagy decreases TRAIL sensitivity.

A. DLD1 cells were grown under normoxic (21% O2, white bars) and hypoxic (0.5% O2, black bars) conditions for 18 h and subsequently challenged with 256 ng/mL TRAIL for the indicated periods of time. Cytosolic Ca2+ levels were measured using Fluo-4 staining and quantified in a microplate reader. To calculate TRAIL-induced Ca2+ influx (Δ RFU), the fluorescence intensity from untreated controls was subtracted from every condition. Values are means ± SEM from three experiments. RFU, relative fluorescent units. B. DLD1 cells were grown as in (A) followed by staining of mitochondria using MitoTracker Green FM. Fluorescence intensity was quantified using a microplate reader and is given relative to the normoxic control. Values are means ± SEM from three experiments. C. DLD1 cells were grown as in (A) and cell proliferation was measured using MTT staining. Values are means ± SEM from three experiments. D. Cells were treated as in (A) followed by autophagosome staining. Fluorescence intensity was quantified using a microplate reader and is given relative to the normoxic control. Values are means ± SEM from three experiments. E. DLD1 cells were grown as in (A) in the presence of the autophagy inhibitor 3MA (12 mM). Subsequently, mitochondria were stained using MitoTracker and fluorescence was quantified in a microplate reader. Data are given relative to the corresponding normoxic controls. Values are means ± SEM from three experiments. F. DLD1, HCT-8 and HCT116 cells were grown as in (A) in the presence and absence of the autophagy inhibitor 3MA (12 mM) and subsequently challenged with the TRAIL (256 ng/mL) for 18 h. Viability was measured using MTT staining. Values are means ± SEM from three experiments. G. DLD1 cells were grown for 18 h under normoxic (21% O2) and hypoxic (0.5% O2) conditions in the presence and absence of the HIF1α inhibitor Bay87-2243 (50 μM). HIF1α levels were analyzed by Western blotting, tubulin served as loading control. H, I. DLD1 and HCT-8 cells were grown as in (A) in the presence and absence of the HIF1α inhibitor Bay87-2243 (25 μM) and subsequently challenged with the indicated concentrations of TRAIL for 18 h. Viability was measured using MTT staining. Values are means ± SEM from three experiments.
