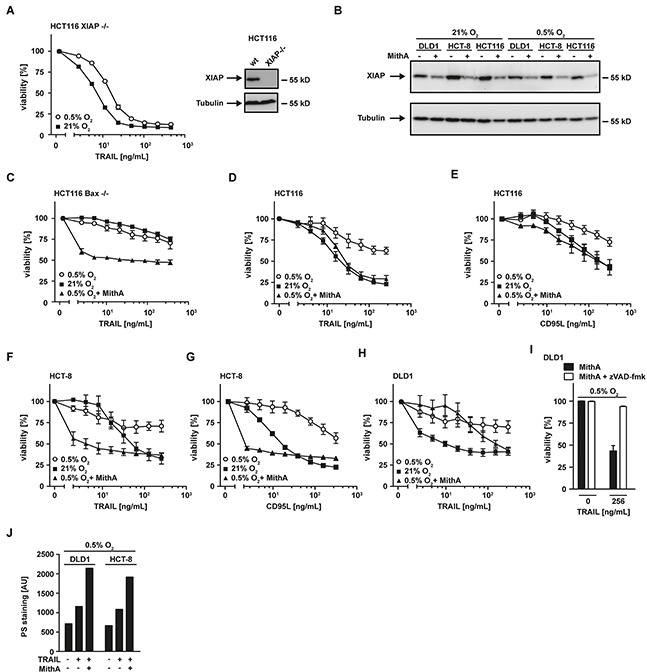
Figure 5. XIAP is critical for hypoxia-induced TRAIL resistance.

A. left panel: HCT116 XIAP−/− cells were grown under normoxic (21% O2) and hypoxic (0.5% O2) conditions for 18 h. Following stimulation with the indicated concentrations of TRAIL for another 18 h, viability was measured using MTT staining. Values are means ± SEM from three experiments. Right panel: XIAP expression in HCT116 wildtype and HCT116 XIAP−/− cells was assessed by Western blotting. Tubulin served as loading control. B. HCT116, HCT-8 and DLD1 cells were grown as in (A) in the presence and absence of mithramycin-A (HCT-8 and DLD1: 125 nM; HCT116: 10 nM). XIAP levels were analyzed by Western blotting, tubulin served as loading control. MithA, mithramycin-A. C–H. HCT116 Bax−/−, HCT116, HCT-8 and DLD1 cells were grown as in (A) in the presence and absence of mithramycin-A (HCT116 Bax−/−, HCT-8 and DLD1: 125 nM; HCT116: 10 nM) Thereafter, cells were stimulated with the indicated concentrations of TRAIL or CD95L for 18 h and cell viability was measured using MTT staining. Values are means ± SEM from three experiments. I. DLD1 cells were grown under hypoxic conditions (0.5% O2) for 18 h in the presence of MithA (125 nM, black bars) or MithA and zVAD-fmk (100 μM, white bars). Subsequently, cells were treated with the indicated concentrations of TRAIL for 18 h. Cell viability was measured using MTT staining. Values are means ± SEM from three experiments. J. DLD1 and HCT-8 cells were grown under hypoxic (0.5% O2) conditions for 18 h in the presence and absence of mithramycin-A (125 nM). Subsequently, cells were challenged with the indicated concentrations of TRAIL for 3 h. Translocation of phosphatidylserine to the outer leaflet of the plasma membrane was measured using a fluorogenic Annexin V derivate. One representative experiment of two performed is shown. PS, phosphatidylserine.
