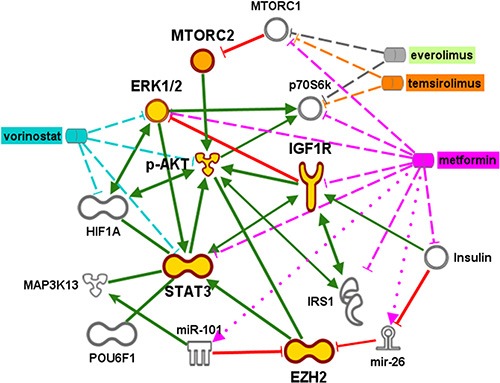
Figure 4. A graphical representation developed using biomedical analytics shows alternative survival pathways and potential therapies for metastatic tumors progressing on rapalog therapy.

Gold symbols indicate phosphoproteins whose weighted scores were input into Ingenuity Pathway Analysis to generate the most likely downstream interactions. Inhibition of MTORC1 activity via temsirolimus or everolimus interaction with the p70S6k subunit releases the brake on MTORC2. Subsequent signaling through pAkt and pERK is predicted to stimulate molecules associated with hypoxia (HIF1α, EZH2) and insulin growth receptors (IGFR, IGF1), via interaction through STAT3. Possible expression of transcription factor POUF6, as well as potential interactions with micro RNA (miR)101 and the micro RNA precursor mir-26 is associated with increased EZH2 expression. Green lines indicate binding or phosphorylation that leads to activation of the downstream protein and red lines indicate phospho-inhibition. Targets of proposed therapies using metformin (pink) and vorinostat (blue) are indicated by dashed or dotted lines. The dotted lines indicate activation, and dashed lines indicate inhibition.
