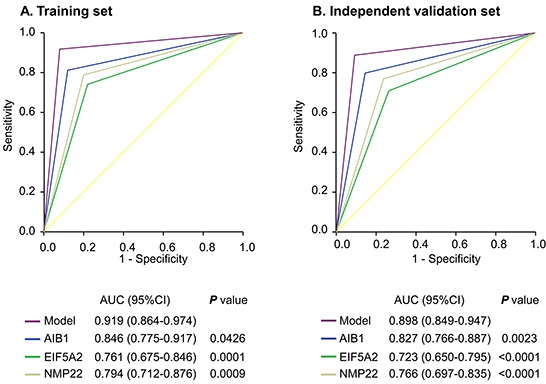
Figure 3. ROC curves comparing the diagnostic performance of the combination model with individual AIB1, EIF5A2, or NMP22 in the training and independent validation sets.

Comparisons of the diagnostic performance by the model and individual AIB1, EIF5A2 or NMP22 in the training cohort A. and independent validation set B..
