
Figure 1. HOXD gene expression and regulation in ES.
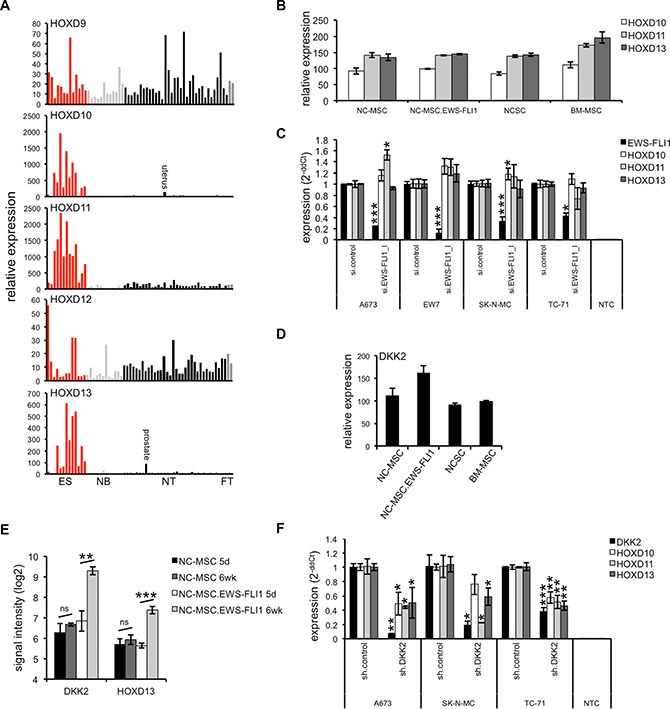
(A) Expression profile of HOXD9 – HOXD13 in ES (red) in comparison to neuroblastoma (NB; light gray), normal (NT; black) and fetal tissue (FT; dark gray). ES and NB RNA were hybridized onto HG U133A arrays (Affymetrix; GSE1825, GSE15757; [50]) and compared to a published microarray study of normal tissue (GSE2361). Each bar represents the expression signal of an individual array. (B) HOXD genes seem not induced after over-expression of EWS-FLI1 in mesenchymal and neural crest stem cells. NC-MSC: control vector transduced neural crest-derived MSC after 5 days in self-renewal media, NC-MSC.EWS-FLI1: EWS-FLI1 transduced NC-MSC after 5 days in self-renewal media, NCSC: undifferentiated, freshly isolated neural crest stem cells, BM-MSC: undifferentiated adult bone marrow derived MSC. (C) Expression of HOXD genes is not affected after suppression of EWS-FLI1 in four different ES lines using RNA interference as measured by qRT-PCR. Data are mean ± SEM; t-test. (D) Expression of DKK2 in undifferentiated stem cell populations (NC-MSC, NC-MSC.EWS-FLI1, NCSC and BM-MSC; from GEO dataset GEO21511, CEL files were RMA normalized by use of expression console software, Affymetrix). (E) Expression of DKK2 and HOXD13 in NC-MSC cells following exposure to differentiation conditions. NC-MSC transduced with GFP-only (NC-MSC) or EWS-FLI1-GFP (NC-MSC.EWS-FLI1) lentiviral vectors were passaged for 5 days in self-renewal media (5 d) and then transferred to differentiation media for 6 weeks (6 wk). Gene expression profiling studies of triplicate samples reveals that exposure to differentiation conditions resulted in up-regulation of DKK2 and HOXD13 in EWS-FLI1+ cells. (F) Suppression of DKK2 by specific shRNA [5] in different ES lines results in a significantly down-regulation of HOXD10, HOXD11 and HOXD13 as measured by qRT-PCR. Data are mean ± SEM; t-test.