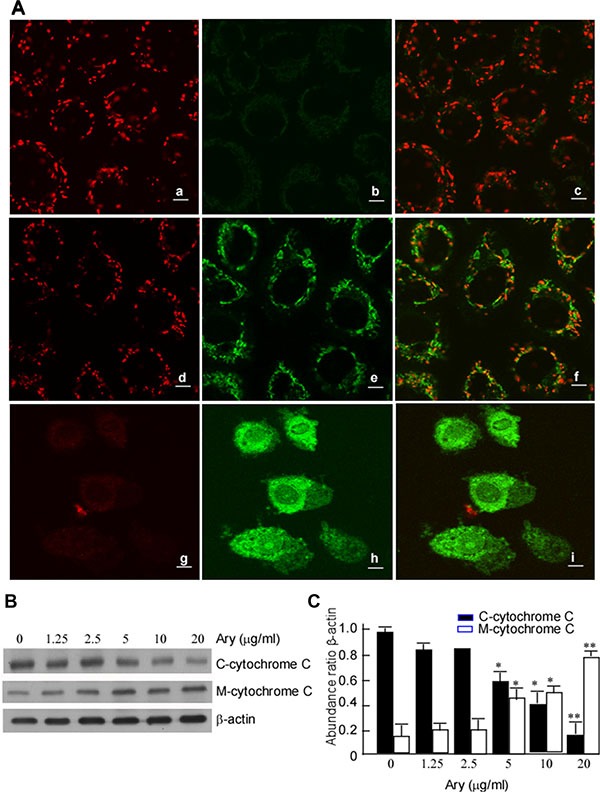
Figure 4. Ary induces the changes of mitochondrial membrane potential.

(A) Hela cells were treated with Ary at the indicated concentrations for 24 h. The treated cells were stained with J-aggregates (red fluorescent) (a, d, g) and JC-1 monomers (green fluorescent) (b, e, h), and observed with confocal microscopy. (a) and (b), blank; (c), emerge of a and b; (d) and (e), 1.25 μg/mL; (f), emerge of d and e; (g) and (h), 2.5 μg/mL; (i), emerge of g and h. (B) C-cytochrome C and M cytochrome C expressions were detected in Hela cells treated with Ary at the indicated concentration using Western-blotting. (C) The abundance ratios of C-cytochrome C or M-cytochrome C expressions to β-actin were calculated. The data were shown as the mean ± SD of three independent experiments by analysis of Student's t test. *P < 0.05, **P < 0.01, vs 0 μg/mL.
