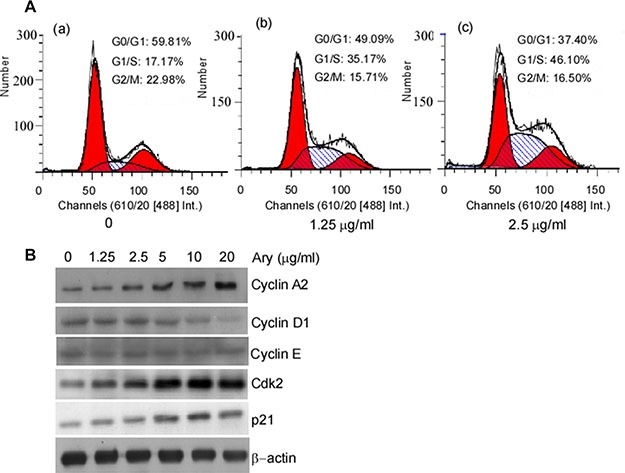
Figure 5. Cell cycle distribution of the cells with Ary treatment.

(A) Hela cells were treated with Ary at the indicated concentration for 24 h. Cell cycle distributions of the treated cells were analyzed by flow cytometry. (a), the blank; (b), 1.25 μg/mL; (c), 2.5 μg/mL. (B) Cyclin A2, cyclin D1, cyclin E, Cdk2 and p21 expressions were detected in the treated cells using Western-blotting.
