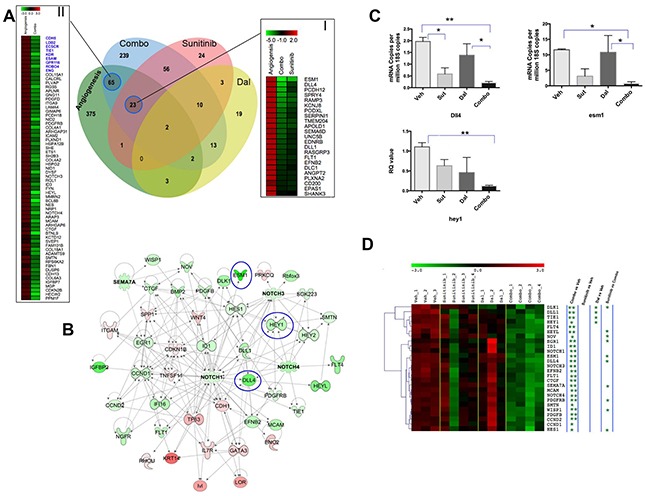
Figure 5. Comparative analysis of tumor angiogenesis signature and RCC xenograft host transcriptome alterations due to sunitinib, dalantercept and combination therapies.

A. Comparative analysis of tumor angiogenesis upregulated genes (Green Circle) with genes that are significantly downregulated with sunitinib (Red Circle), dalantercept (Yellow Circle) and combination therapy (Blue Circle). Combination therapy significantly downregulated ~20% of the upregulated genes (i.e. 92 genes) from the primary tumor angiogenesis signature. Panel I depicts fold change based heatmap of 23 angiogenesis related genes that are downregulated both due to sunitinib and combination therapy. Panel II shows the heatmap of 65 angiogenesis related genes that are only significantly downregulated by combination therapy but not by monotherapy. The panel consists of 9 out of top 20 angiogenesis related genes (shown in Blue) as identified by Masiero et al [22]. B. Key regulatory molecules associated with combination treatment. Heatmap depicts key regulatory genes that are specifically inhibited or activated by combinationtreatment. Magnitude of activation and inhibition is calculated on the basis of Z-score and shown using pseudocolor scale (−3 to 3) with red color denoting activated and green color denoting inhibited key regulators. An interactive network of combo effected key regulator and target genes are also shown. The intensity of node color indicates the degree of up-regulation (red) and down-regulation (green) by combination treatment compared to untreated samples. C. Validation of Notch signaling target genes altered by combination treatment. RT-PCR was performed on vehicle, sunitinib, dalantercept and combination treated tumors in triplicate with at least two tumors per arm (n=2-3 tumors per arm). Graph shows mean ± SEM of relative mRNA levels after normalization to 18S copies. *, P< 0.05, **, P<0.01. D. Combination therapy significantly (P<0.01) downregulated expression of more than 2 dozen endothelial specific genes. The analysis was performed after normalizing the transcript expression to the expression of VWF, an endothelial specific gene. Shown is the heatmap of endothelial genes significantly downregulated by combination therapy. The columns represent samples and the rows represent genes. Gene expression is shown with a pseudocolor scale (−3 to 3) with red color denoting increase and green color denoting decrease in gene expression. The significance of downregulation of endothelial genes in different comparisons is shown by asterisk (** P<0.001, * P<0.05).
