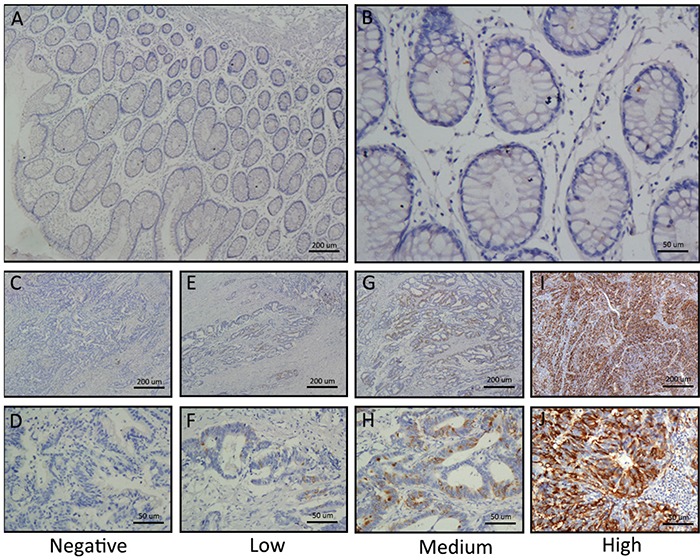
Figure 3. Differential expression of TACC3 in CRC tissues shown by IHC staining.

A and B. Negative TACC3 staining in normal colorectal tissues (negative control); (A) 40×, (B) 200×. C and D. Negative TACC3 staining in CRC tissue; (C) 40×, (D) 200×. E and F. Weak TACC3 staining in cytoplasm; (E) 40×, (F) 200×. G and H. Moderate TACC3 staining in cytoplasm; (G) 40×, (H) 200×. I and J. Strong TACC3 staining in cytoplasm; (I) 40×, (J) 200×.
