
Figure 4. Correlation between TACC3 expression and survival outcomes.
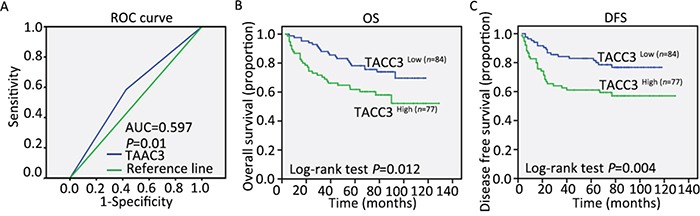
A. The sensitivity and 1-specificity of TACC3 expression in CRC tissues were plotted. The area under the curve (AUC) and the p value as calculated by ROC curve analysis are indicated (AUC = 0.597, P = 0.01). The five-year overall survival (OS) rate was 50.7% in the 161 patients with CRC. B and C. High TACC3 expression was significantly correlated with OS (P = 0.012) and DFS (P = 0.004) in all of the included patients with TACC3.