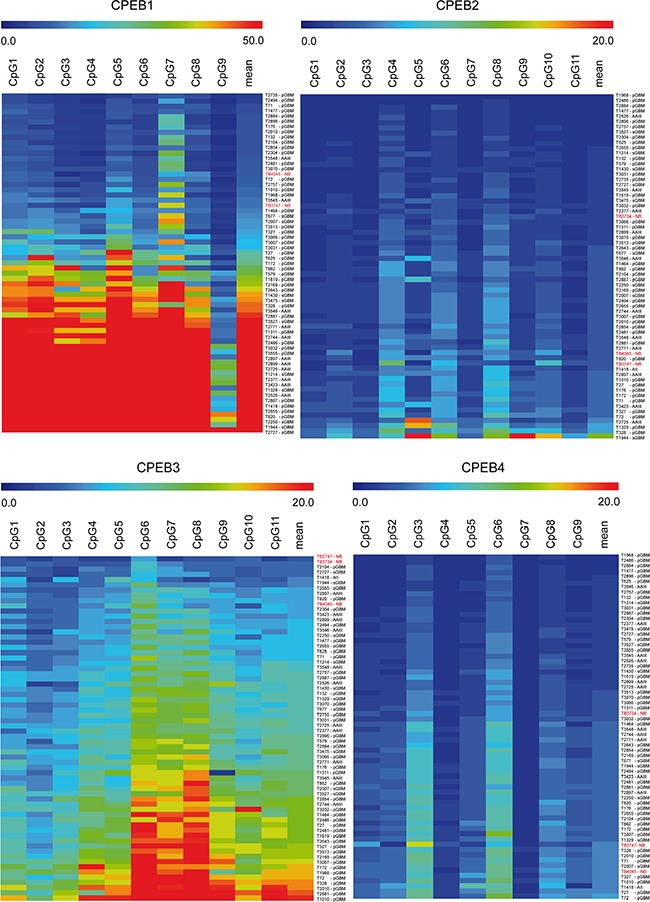
Figure 1. Methylation profile of CPEB1-4 genes in glioma and reference tissue measured by pyrosequencing.

Scale above heat maps displays the specific methylation areas in % (range 0–50% for CPEB1 and 0–20% for CPEB2-4). Columns correspond to the investigated CpG dinucleotides, whereas rows to the individual glioma (WHO grade II–IV, n = 63) and control normal brain (NB, labeled in red, n = 3) tissue samples. Blue color on heat map indicates lack of methylation, while red corresponds to increased methylation of CpG sites in investigated tumors.
