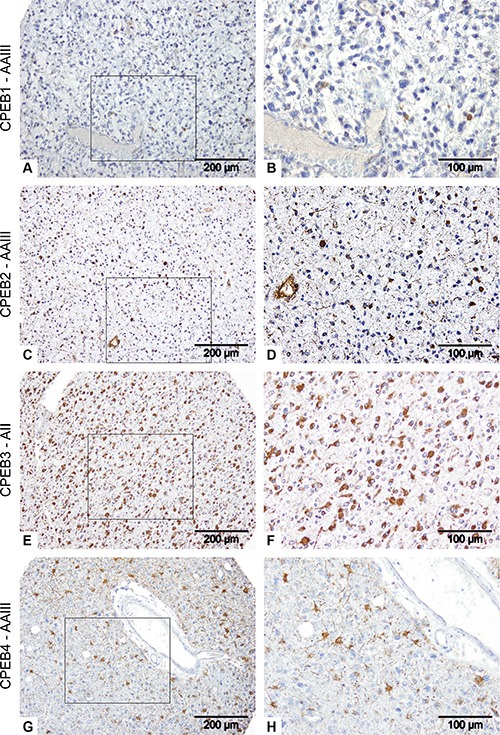
Figure 2. Analysis of CPEB protein expression in gliomas.

Immunohistochemical staining of AAIII (A–D, G, H) and AII (E, F) specimens. A, B: CPEB1; C, D: CPEB2; E, F: CPEB3 and G, H: CPEB4. Brown areas represent CPEBs immunoreactivity, while blue hematoxylin staining corresponds to cell nuclei.
