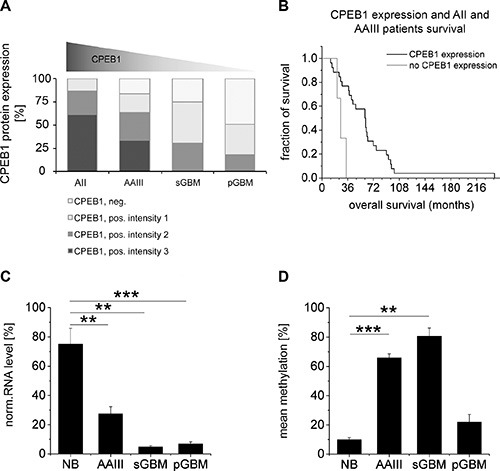
Figure 3. Comparison of CPEB1 methylation and expression with glioma patient survival.

(A) Downregulation of CPEB1 protein expression was observed with rising glioma malignancy. Strong expression of CPEB1 was restricted to low-grade astrocytoma samples, while most of the GBMs showed low CPEB1 immunoreactivity. Light grey graph sections correspond to the lack of CPEB expression, while grey and dark grey sections to increasing CPEB staining divided into intensity groups (1: weak, 2: intermediate, 3: strong). (B) Correlation between expression of CPEB1 and patient survival. Kaplan- Meier survival analysis showed a correlation between CPEB1 expression in low-grade gliomas and longer survival of patients (n = 29, p < 0.01). (C) Compared to non-tumor control samples (NB, n = 6), a significant reduction of CPEB1 transcript was observed in AAIII (n = 6, p < 0.01), sGBM (n = 3, p < 0.01) and pGBM (n = 16, p < 0.001). Error bars indicate standard error of the mean. (D) Methylation of CPEB1 gene was significantly increased in AAIII (n = 6, p < 0.001) and sGBM (n = 3, p < 0.01), but not in pGBM, when compared to normal brain samples. Error bars indicate standard error of the mean.
