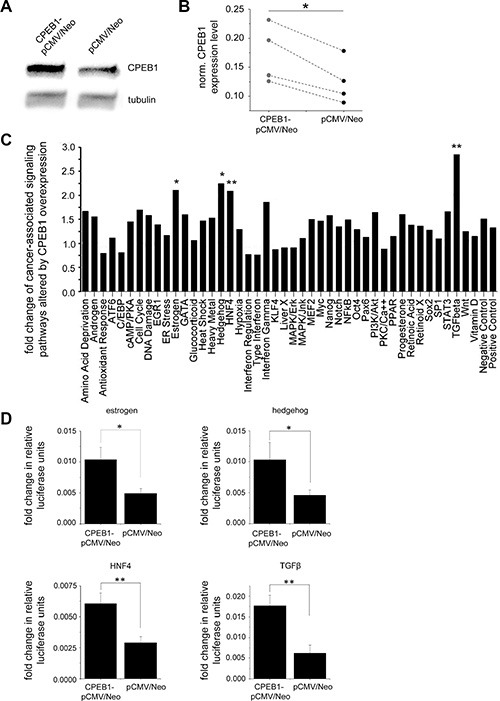
Figure 4. Alternation of cancer-associated signaling pathways by CPEB1.

(A, B) Transient overexpression of CPEB1-pCMV6/Neo or control pCMV6/Neo plasmid in A172 cultured glioblastoma cells monitored by immunoblot (n = 4, p < 0.05). (C) Quantitative analysis of cancer associated signaling pathways investigated by pathway reporter array (n = 3). Diagram depicts the change of reporter activity indicative of specific cancer-related pathways altered by CPEB1 overexpression. Fold change was obtained by dividing the pathways activity upon CPEB1-pCMV6/Neo expression by activity upon control pCMV6/Neo plasmid. (D) Statistical quantification of estrogen (n = 3, p < 0.05), hedgehog (n = 3, p < 0.05), HNF4 (n = 3, p < 0.01) and TGFβ (n = 3, p < 0.01) pathways. Error bars indicate standard error of the mean.
