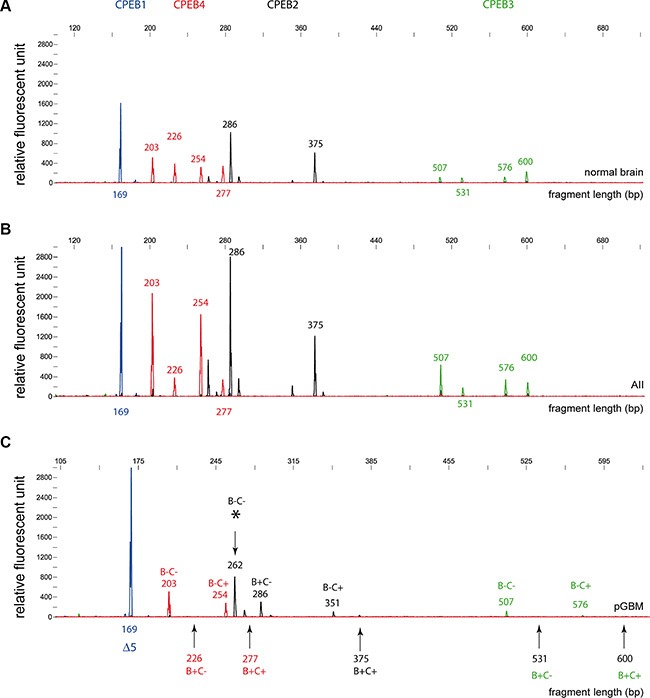
Figure 5. Fragment analysis of CPEB alternative splice variants in gliomas and normal brain specimens.

RT-PCR analysis revealed the abundance of respective splice variants of the four CPEB genes. Values on the x-axis correspond to the length of the RT-PCR product generated for the fragment analysis in base pairs. Vertical y-axis defines signal intensity (relative fluorescent units), which is proportional to the amount of generated PCR product. The size of the RT-PCR product generated for the fragment length analysis did not describe the actual length of the respective splice product. Differences between splice variants are due to presence or absence of respective B- or C-regions. (A) CPEB isoforms in normal brain tissue are: CPEB1Δ5 (169 bp); CPEB2c (286 bp; lack of C and E-region), CPEB2a (375 bp; full isoform), CPEB3d (507 bp; lack of B and C-region), CPEB3c (531 bp; lack of C-region), CPEB3b (576b; lack of B-region), CPEB3a (600bp; full isoform); CPEB4d (203bp; lack of B and C-region), CPEB4c (226 bp; lack of C-region), CPEB4b (254 bp; lack of B-region), CPEB4a (277 bp; full isoform of CPEB4). (B) The splice variants detected in normal brain were also present in AII/AAIII gliomas. (C) In GBM samples, loss of several CPEB2, CPEB3 and CPEB4 (arrows) splice variants was observed. Interestingly, GBM samples displayed a unique CPEB2 variant (asterisk) that only showed a trace signal in normal brain. Additional information on the respective splice variants is given in Supplementary Figure S2 and Supplementary Tables S4 and S5.
