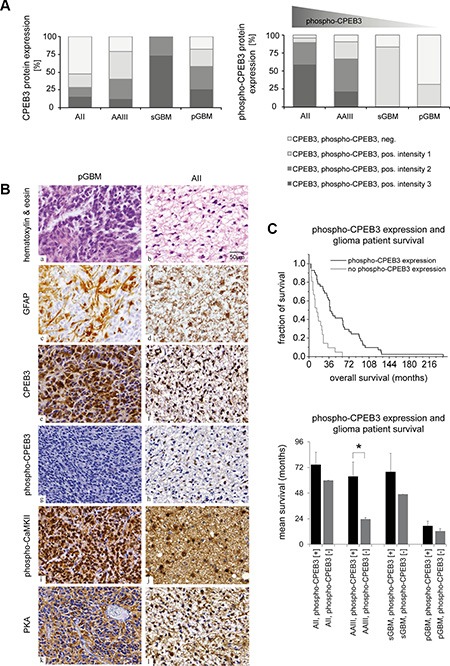
Figure 6. Altered CPEB3 activity in gliomas and its correlation with overall patient survival.

(A) Evaluation of CPEB3 and phospho-CPEB3 protein expression in gliomas. Light grey graph sections correspond to the lack of CPEB expression, while grey and black sections to CPEB expression. Immunoreactivity was divided into intensity groups (1: weak, 2: intermediate, 3: strong). Upregulation of CPEB3 expression and reduction of phospho-CPEB3 activity was observed in parallel to the growing grade of glioma malignancy. (B) Expression of CaMKII and PKA kinases induce the activation of CPEB3 protein in gliomas. Representative staining of pGBM: a, c, e, g, i, k and AII: b, d, f, h, j, l tissue samples. Pictures a, b present cell nuclei stained with violet hematoxylin, and cell cytoplasm stained with pink eosin. On the remaining pictures (c-l), dark blue areas represent cell nuclei stained by hematoxylin, while brown areas correspond to respective antibody staining: GFAP: c, d; CPEB3: e, f; phospho-CPEB3: g, h; phospho-CaMKII: i, j; PKA: k, l. (C) Correlation between phospho-CPEB3 expression and overall patient survival observed in all investigated glioma samples (p < 0.001, upper panel). The positive link between phospho-CPEB3 expression and prolonged mean patient survival was particularly evident for AII (n = 8), AAIII (n = 20, p < 0.01) and sGBM (n = 8) (Figure 6C- lower panel). Error bars indicate standard error of the mean.
