
Figure 1. Resistance to erlotinib in NSCLC cells is associated with EMT.
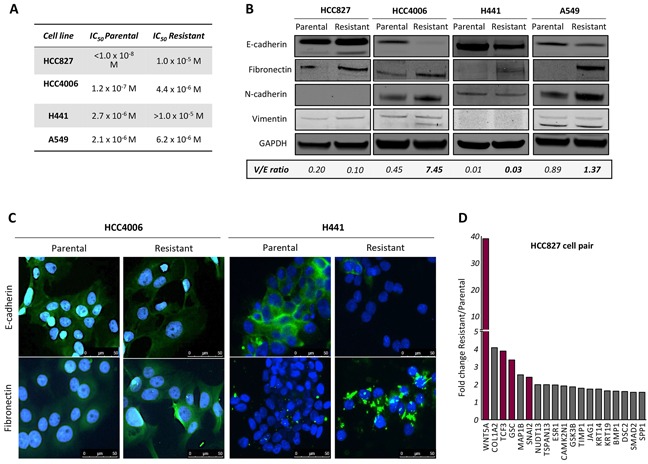
A. Calculated IC50 values for parental and erlotinib-resistant tumor cell lines. B. Western blot analysis of protein lysates from indicated tumor cell pairs. Indicated below is the ratio of vimentin to E-cadherin (V/E) for each cell line (normalized to GAPDH). C. Representative images of HCC4006 and H441 parental vs. erlotinib-resistant cells assayed by immunofluorescence analysis of epithelial E-cadherin and mesenchymal fibronectin (green signal) in tumor cell pairs. Blue signal corresponds to DAPI stained nuclei. D. Fold change expression of EMT-related genes in resistant vs. parental HCC827 cells determined by real time PCR expression.