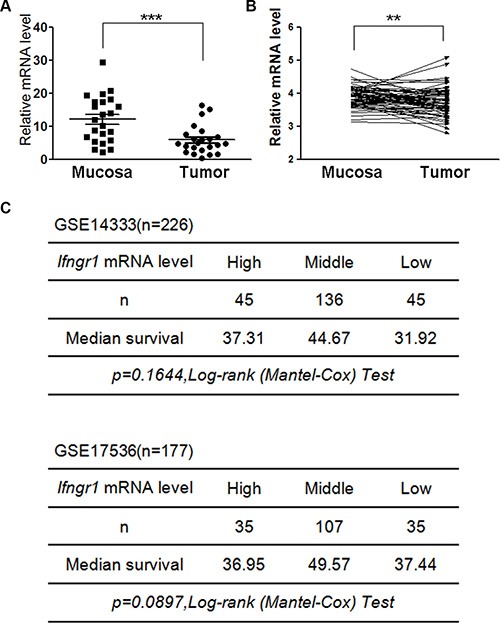
Figure 5. Expression levels of IFNGR1 in colon cancers.

(A) 30 pairs of intestinal mucosal tissues and tumors were excised from Apcmin/+ mice, and expression levels of Ifngr1 were evaluated by qRT–PCR (*P < 0.05, **P < 0.01, ***P < 0.005, Unpaired t test). (B) IFNGR1 mRNA levels in normal and cancer tissues of colorectal cancers patients were compared. Data were from GSE20842 (*P < 0.05, **P < 0.01, ***P < 0.005, Paired t test). (C) IFNGR1 expression levels and prognosis in human colorectal cancer. Survival information and expression levels of Ifngr1 were obtained from the public available databases (GSE14333 and GSE17536).
