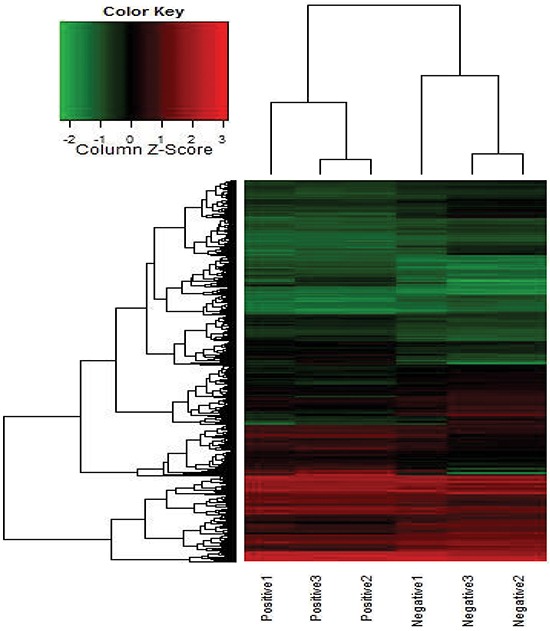
Figure 1. Heat map for the co-expression mRNAs of GAPLINC expressed in MLNs compared with NLNs.

Each row represents one mRNA, and each column represents one sample. Red indicates an increase and green indicates a decrease in relative mRNA expression.
