
Figure 6. Microarray analysis investigating the GAPLINC-associated genes.
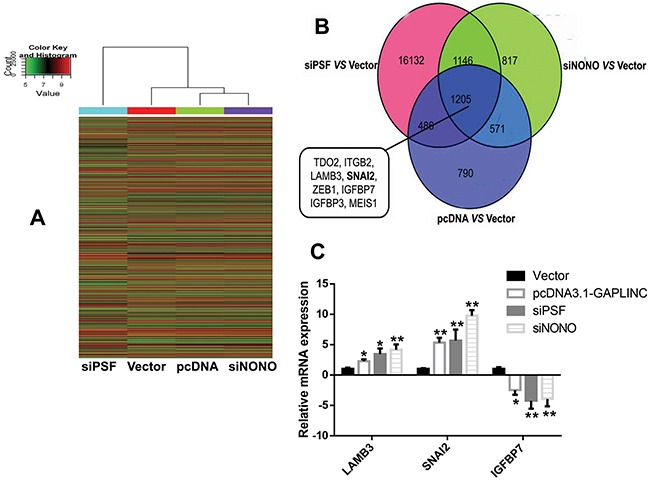
A. Heat map image of different gene expression in the HCT116 cells transfected with empty vector, GAPLINC-pcDNA3.1, PSF-siRNA, and NONO-siRNA. Red indicates an increase and green indicates a decrease. B. Venn diagram of genes with altered gene expression as identified using microarray analysis. Representative genes found in the overlap between these three groups are displayed. C. RT-qPCR was used to detect the mRNA levels of LAMB3, SNAI2, and IGFBP7 in the HCT116 cells treated with empty vector, GAPLINC-pcDNA3.1, PSF-siRNA, and NONO-siRNA. Data represent the mean ± standard deviation from three independent experiments. *P < 0.05, **P < 0.01.