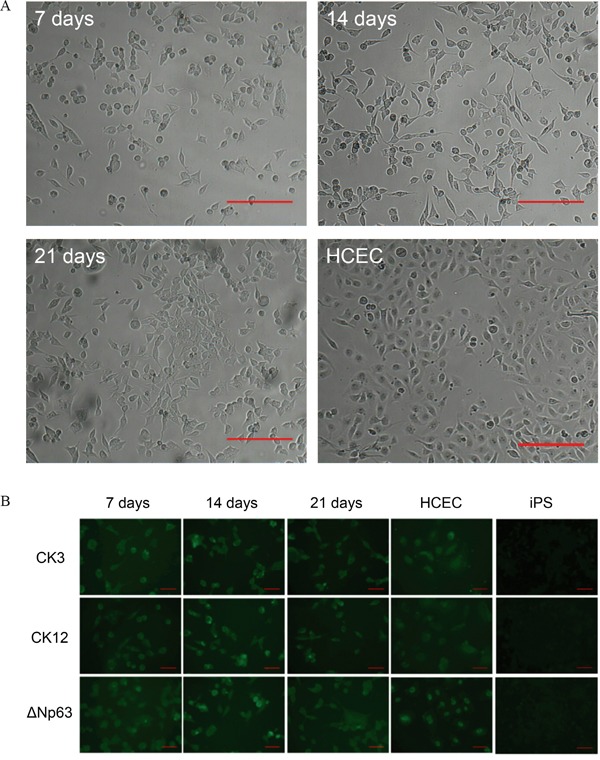
Figure 3. Differentiation of iPS cells to the corneal epithelial lineage.

A. Bright-field images of differentiated iPS cells at day 7 of the experiment, day 14, day 21, and HCEC as positive control. Scale bar: 200 μm. B. Immunocytochemistry analysis of differentiated iPS cells for the expression of CK3, CK12 & ΔNp63 at day 7, day 14 and day 21. HCEC served as positive control. Scale bar: 50 μm.
