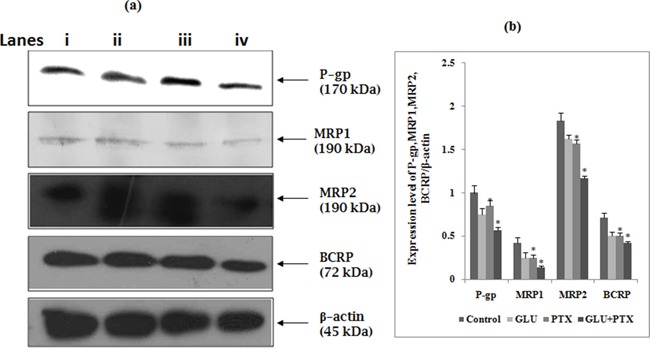
Figure 5. Effect of GLU-PTX on the expression pattern of P-gp-170kDa, MRP1-190kDa, MRP2-190kDa, BCRP-72kDa and β-actin-45kDa expression in KB cells.

a. Lane (i) control, (ii) GLU, (iii) PTX, (iv) GLU-PTX and band intensities were scanned by densitometer (Image ‘J’ software). b. The graph represents the P-gp, MRP1, MRP2 and BCRP quantification values normalized to β-actin levels. Densitometric analysis is shown in *p<0.05 vs GLU/PTX group. All the data shown are representative of three independent experiments.
