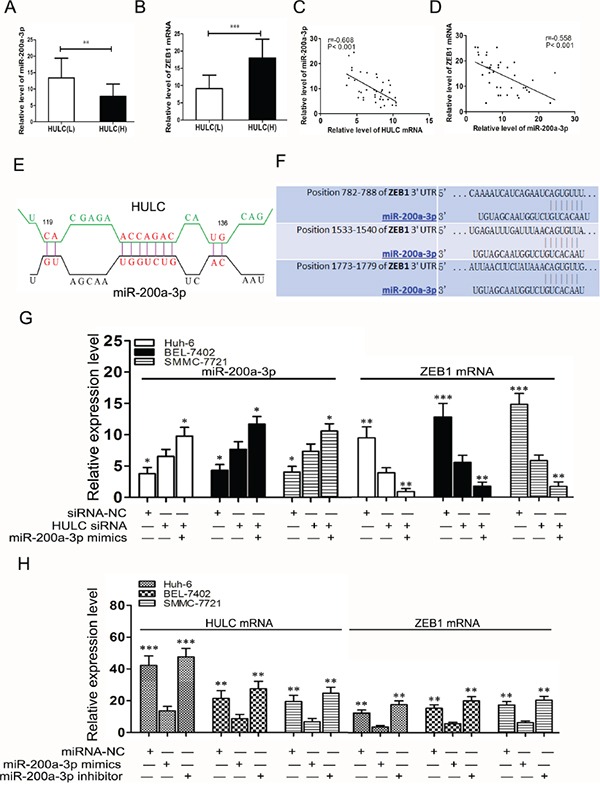
Figure 3. HULC increased ZEB1 by sequestering miR-200a-3p.

A. Analysis of miR-200a-3p expression levels in HULC(L) and HULC(H) groups of HCC tissues as determined using qRT-PCR and normalized to GAPDH expression. B. QRT-PCR was used to detect expression levels of ZEB1 mRNA in HULC(L) and HULC(H) groups of HCC tissues and normalized to GAPDH expression. C. Correlations between HULC and miR-200a-3p expression in HCC tissues. D. Correlations between miR-200a-3p and ZEB1 mRNA expression in HCC tissues. E. A model showing the predicted interaction between HULC and miR-200a-3p through complementary base-pairs. F. A photograph showing the predicted interaction between miR-200a-3p and ZEB1 mRNA through complementary base-pairs.G. Relative expressions of miR-200a-3p and ZEB1 mRNA as determined using qRT-PCR in Huh-6, BEL-7402 and SMMC-7721 cells transfected with HULC siRNA or miR-200a-3p mimics. H. Relative expressions of ZEB1 and HULC mRNA were measured by qRT-PCR in Huh-6 and BEL-7402 cells transfected with miR-200a-3p mimics or inhibitor. Values shown indicate mean ± SD. *P < 0.05, **P < 0.01, ***P < 0.001.
