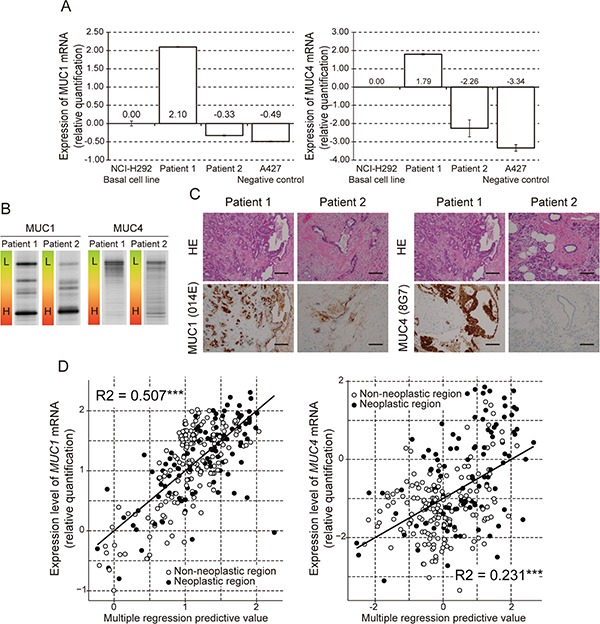
Figure 1. Analysis of MUC1 and MUC4 expression and methylation status in human pancreatic samples.

A. Expression of MUC1 and MUC4 mRNA examined by quantitative real time RT-PCR. The bar graphs show gene expression levels relative to those in NCI-H292 cells. The A427 cell line was used as a negative control. B. DNA methylation of the MUC1 and MUC4 promoter region examined by MSE. L: Low methylated. H: High methylated. Pancreatic tissue from patient 1 showed hypomethylated MUC1 and MUC4. Pancreatic tissue from patient 2 showed hypermethylated MUC1 and MUC4. C. Expression of MUC1 and MUC4 protein examined by immunohistochemical staining. HE: Hematoxylin and Eosin Staining. Magnification: ×20. Scale bar: 100 μm. D. Multiple regression analysis of mRNA expression against expression level of CAIX and DNA hypomethylation status in MUC1 or MUC4. R2: R squared, ***: p<0.001, **: p<0.01, *: p<0.05.
