
Figure 2. Multiple regression analysis of hypomethylation status of MUC1 or MUC4 against expression level of DNA methylation-related enzymes.
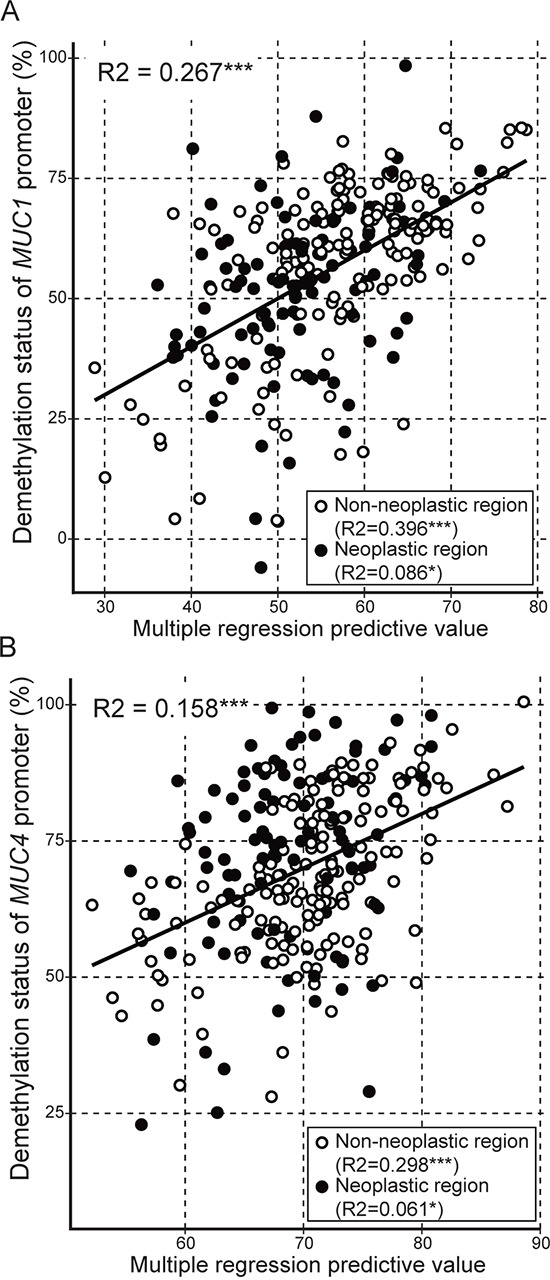
The multiple regression predictive value was obtained from following formulas. A. Fm (hypomethylation status of MUC1) = 57.102 − 3.789(TET3) + 7.553(DNMT1) + 24.020(DNMT3a) − 8.897(AID), B. Fm (hypomethylation status of MUC4) = 57.894 − 3.039(TET3) + 17.825(DNMT3a). R2: R squared, ***: p<0.001, **: p<0.01, *: p<0.05, ○: non-neoplastic region, ●: neoplastic region.