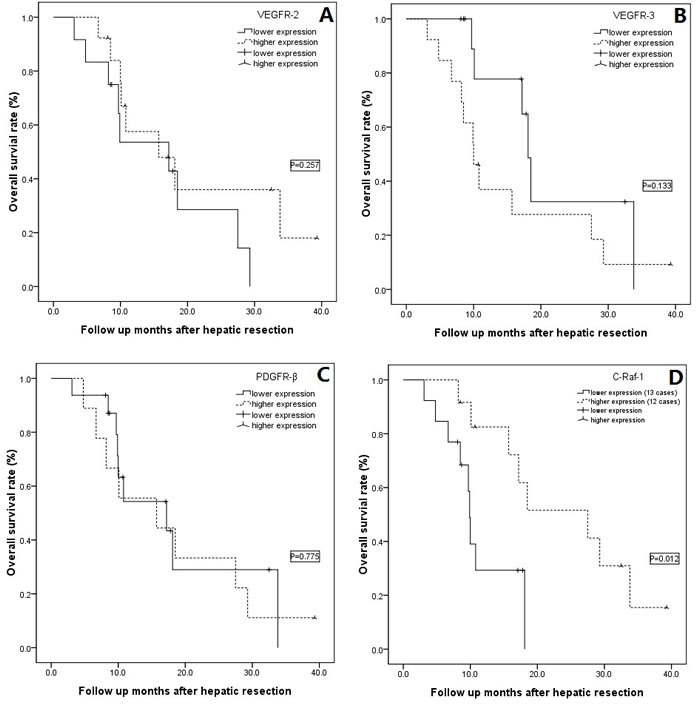
Figure 2. A-D: Subgroup overall survival analysis according to VEGFR-2/3, PDGFR-β and c-Raf-1 expression.

A. No difference was detected in the overall survival between the VEGFR-2 low- and high-expression groups (P = 0.257); B. No difference was detected in the overall survival between the VEGFR-3 low- and high-expression groups (P = 0.133); C. No difference was detected in the overall survival between the PDGFR-β low- and high-expression groups (P = 0.775); D. The cases with high levels of c-Raf-1 expression showed significantly higher overall survival than the cases with lower levels of this biomarker (P = 0.012).
