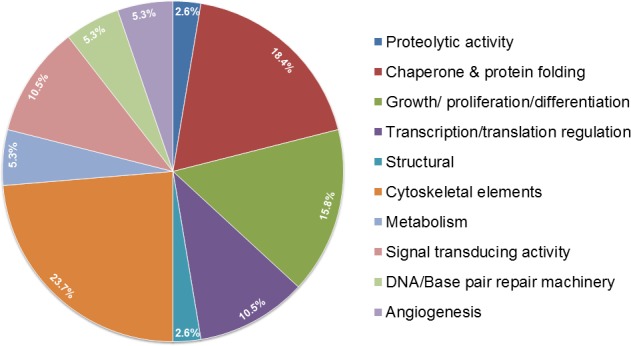
Figure 3. Pie chart depicting the binding partners of OPG from mass spectrometry analysis.

A. pull-down with anti-OPG antibody revealed a myriad of proteins involved in different cellular functions in inflammatory and aggressive breast cancer cells.

A. pull-down with anti-OPG antibody revealed a myriad of proteins involved in different cellular functions in inflammatory and aggressive breast cancer cells.